
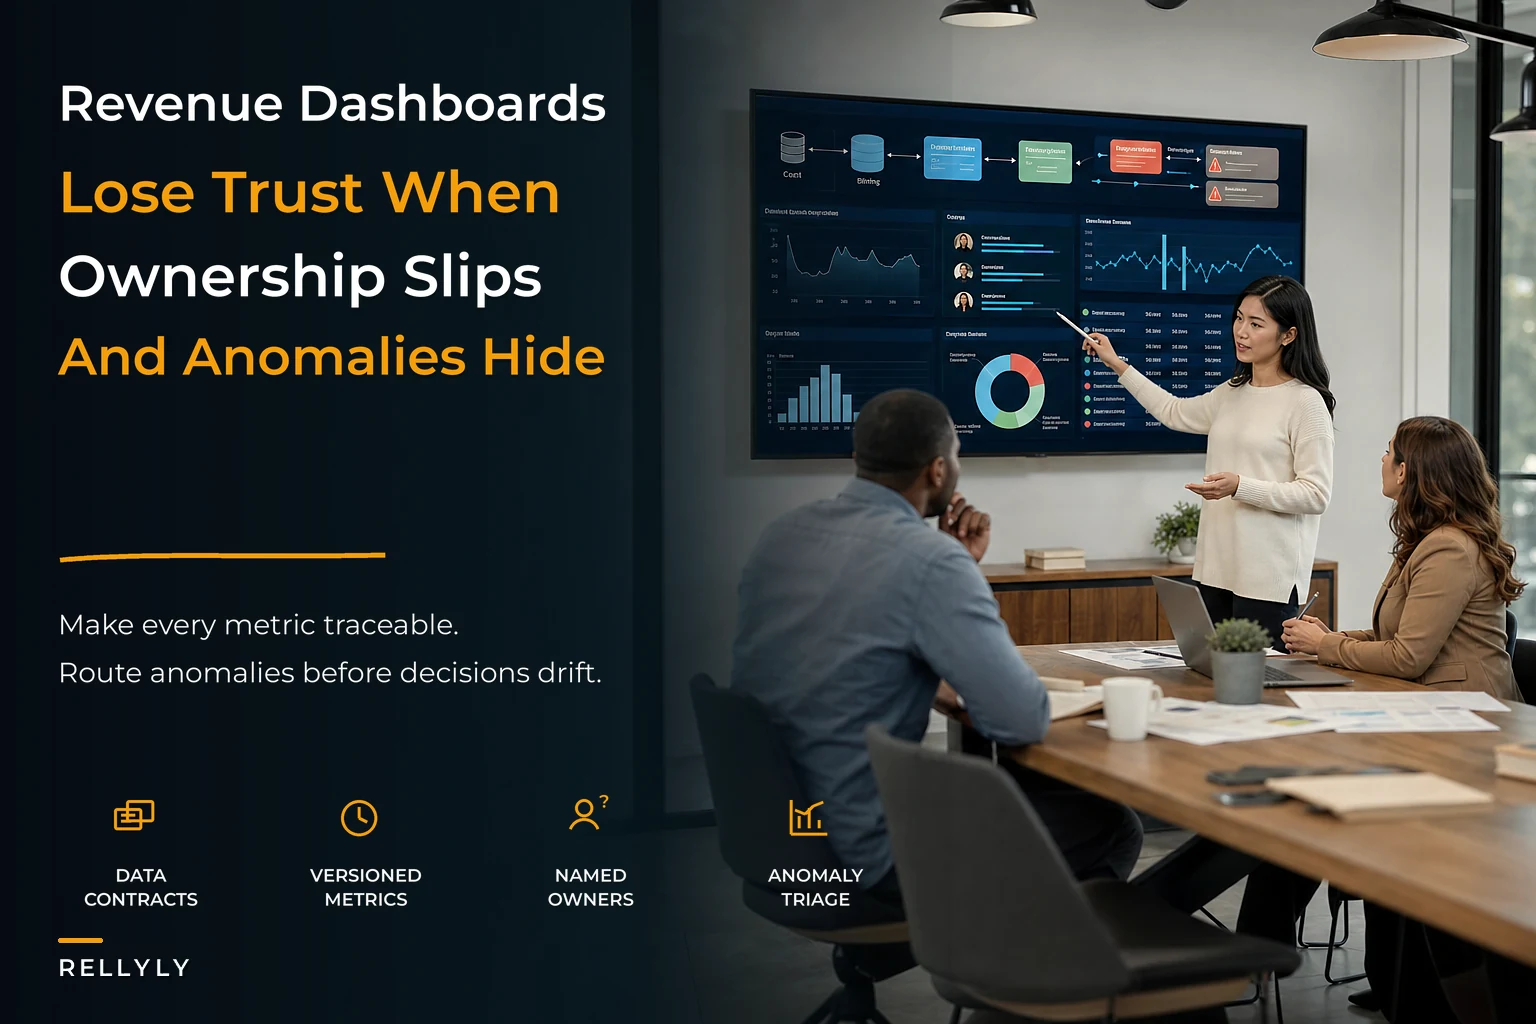

There's a specific moment that tells you your revenue reporting is broken. It's the meeting where someone pulls up a dashboard, states the ARR number, and half the room immediately starts checking their own spreadsheets. Nobody says "that's wrong," but nobody fully believes it either. The meeting quietly turns into a debate about which number is real instead of what to do about it.
That distrust is the actual problem. Not the dashboard itself. When people don't trust the reporting layer, they build shadow reports — and once shadow reports exist, there's no single truth anymore, just a collection of competing versions that all look official.
A revenue reporting operating model is the set of rules, owners, and checks that make one set of numbers trustworthy enough that people stop building their own. It's less about the BI tool and more about who owns what, how fast problems get caught, and what happens when a number looks wrong.
Why "one dashboard" isn't the same as "trusted reporting"
Most teams think the fix for reporting chaos is consolidation. Kill the extra spreadsheets, put everything in one dashboard, done. It never works.
A dashboard is just a display. It shows whatever the underlying data and logic produce. If the logic is undocumented, the data pipeline breaks silently, and nobody officially owns the accuracy of a given metric — then consolidating just means you now have one place to be confidently wrong. You've centralized the display without centralizing the trust.
What happens across a lot of revenue teams is that the distrust rarely comes from big, obvious errors. It comes from small, unexplained shifts. Net new ARR drops 8% week over week, nobody knows why, and by the time someone digs in, it turns out a rep changed a close date and it re-bucketed a deal into a different period. No alarm, no owner, no explanation. Just a number that moved and eroded a little more confidence.
Trust is built on three things the dashboard alone can't give you:
-
Someone is accountable for each core metric being correct
-
Changes to how a metric is calculated are visible and don't happen silently
-
When something looks off, it gets explained quickly — not three weeks later
Those three things are the actual operating model. The dashboard is downstream.
The four pillars of a reporting operating model
Each piece below solves a specific failure that shows up as the business scales.
Never miss a customer touchpoint again.
Rellyly helps you manage contacts, tasks, and sales efficiently in one platform.
- Unified customer profiles
- Automated follow-ups
- Sales pipeline tracking
No credit card required
| Pillar | What it solves | What breaks without it |
|---|---|---|
| Metric versioning | Silent definition changes | Two teams report different ARR and both are "right" for their version |
| Owner SLAs | Nobody accountable for accuracy | Errors sit for weeks; blame gets diffuse |
| Data contracts | Upstream changes breaking reports | A CRM field rename quietly zeroes out a whole segment |
| Automated anomaly triage | Errors caught too late | Bad numbers make it into the QBR before anyone notices |
The mistake most teams make is trying to fix reporting by adding more dashboards or more detail. The better move is adding structure to the four things above. More views don't create trust. Clear ownership and fast error detection do.
Pillar 1: Metric versioning
This is the one people skip, and it causes the most damage. Every important metric — ARR, net new, churn, pipeline coverage, win rate — has a definition. And those definitions change over time, usually without anyone announcing it. A typical example: your churn number used to exclude downgrades. Then someone decided downgrades should count as partial churn because leadership wanted a tougher view. The calculation changed. But last quarter's board deck used the old definition, and now your trend line has a discontinuity nobody flagged. Anyone comparing quarters sees a spike that's purely definitional.
Versioning means treating metric definitions like you'd treat anything else that matters: written down, dated, and changed on purpose.
Practically, a metric definition should carry:
-
The plain-English definition ("Net new ARR = new logo ARR + expansion ARR − contraction − churn, measured on contract start date")
-
The exact fields and filters it pulls from
-
The version number and the date it changed
-
Who approved the change and why
When a definition changes, the old version doesn't get deleted — it gets retired with a date. That way, when someone pulls a report from six months ago, you can explain exactly why it differs from today's. This single practice kills most "why don't these numbers match" arguments, because now there's an answer instead of a shrug.
Pillar 2: Owner SLAs
Every core metric needs a named owner. Not a team — a person. "RevOps owns the dashboard" is not ownership; it's a group everyone can point at and no one is responsible for.
The owner's job isn't to build the report. It's to be accountable for it being right, and to respond within a defined window when it isn't. That's the SLA part. Without a time commitment, "owner" just means "person we email who eventually replies."
A workable owner SLA looks like this:
-
Metric owner confirms the weekly numbers are accurate before the reporting window closes (say, by Monday noon)
-
When an anomaly is flagged, the owner acknowledges within 4 business hours and provides a preliminary explanation within one business day
-
Any change to the metric definition gets logged and communicated before it hits the live dashboard, not after
What breaks without this is subtle. When nobody owns a number, small errors don't get fixed because fixing them isn't anyone's job. They accumulate. Six months later the dashboard has three metrics people quietly know are unreliable, and "everyone knows you can't trust the expansion number" becomes tribal knowledge. That's the beginning of the end for a reporting layer.
One pattern worth noting: the metric owner and the person who acts on the metric should usually be different people. If the same person who owns the forecast number also owns whether it's accurate, there's a soft incentive to not look too hard at inconvenient anomalies. Separation keeps it honest.
Pillar 3: Data contracts
This is where reporting quietly dies at scale, because the failure happens upstream of anyone who looks at dashboards.
A data contract is an agreement about what upstream data will look like — which fields exist, what format they're in, what's required, what can't change without notice. Your reports depend on assumptions about CRM data. When those assumptions break, the report breaks, but usually silently.
A scenario that plays out constantly: someone in the sales ops team renames a picklist value in the CRM — "Closed Won" becomes "Won." Harmless-looking. But the ARR calculation was filtering on the exact string "Closed Won." Now that filter matches nothing for new deals. The dashboard doesn't error out. It just shows new ARR trailing off, and it takes days before someone realizes it's not a slow sales week — it's a broken filter.
A data contract prevents this by making the dependency explicit. The reporting layer declares: "I depend on the Opportunity Stage field, these specific values, this format." Anyone changing those fields knows there's a downstream consumer with expectations. Ideally the change gets caught before it ships. This connects directly to the discipline behind a solid CRM canonical data model — reporting is only as trustworthy as the data contract underneath it.
Log CRM field or value changes in the data contract and notify downstream metric owners before deploying them.
The bigger point: as a business grows, the number of people who can change upstream data grows too. In a 10-person company, one person touches the CRM config. At 60 people, you've got sales ops, marketing ops, an admin, and three managers with edit rights. Every one of them can break a report without knowing a report exists. Data contracts are how you scale past the point where informal "hey, don't touch that field" agreements stop working.
Pillar 4: Automated anomaly triage
The first three pillars prevent problems. This one catches the ones that slip through — fast, before they poison a decision.
Manual anomaly detection doesn't scale, and honestly it doesn't really work even at small scale, because humans only notice a weird number when they happen to be looking at it. Most bad numbers get discovered in the meeting where they matter most, which is the worst possible time.
Automated triage means the system watches the metrics and flags when something deviates from what's expected — a week-over-week swing beyond a threshold, a segment that suddenly goes to zero, a metric that moves in the opposite direction from a correlated one. The key word is triage, not just alerting. An alert that says "ARR changed 12%" is noise. A useful triage flag says what changed, which segment drove it, and routes it to the owner with a first guess at the cause.
A good triage flow does three things:
-
Detects the anomaly against an expected range
-
Enriches it — which accounts, which stage, which field changed — so the owner isn't starting from zero
-
Routes it to the metric owner with the SLA clock started
This is where AI-assisted reporting tools genuinely help, and not in a gimmicky way. Instead of a person eyeballing dashboards hoping to catch drift, the system can compare a metric against its own history, spot that expansion ARR dropped mainly in one region, and surface the three deals that re-bucketed — all before the owner even opens the dashboard. That turns a three-week-old mystery into a same-day explanation. The value isn't automation for its own sake; it's compressing the time between "something's wrong" and "here's why."
A workflow that ties it together
Here's how the four pillars operate together in a normal week, in plain terms:
Data flows in from the CRM and billing systems, governed by data contracts that define what's allowed to change. The metrics get calculated using versioned definitions, so everyone's working from the same logic. Overnight, automated triage compares each metric to its expected range. When it finds a deviation, it enriches the flag with context and routes it to the metric owner, starting the SLA clock.
The owner gets a flag Monday morning: "Net new ARR down 9% vs. trailing 4-week average, concentrated in the mid-market segment, driven by 3 deals moving close dates into next period." They confirm it's a legitimate timing shift, annotate the dashboard, and the number stands — now with an explanation attached. By the time the team meeting happens, there's no debate. The dip is understood.
Visualizing that flow makes the handoffs and timing clearer.
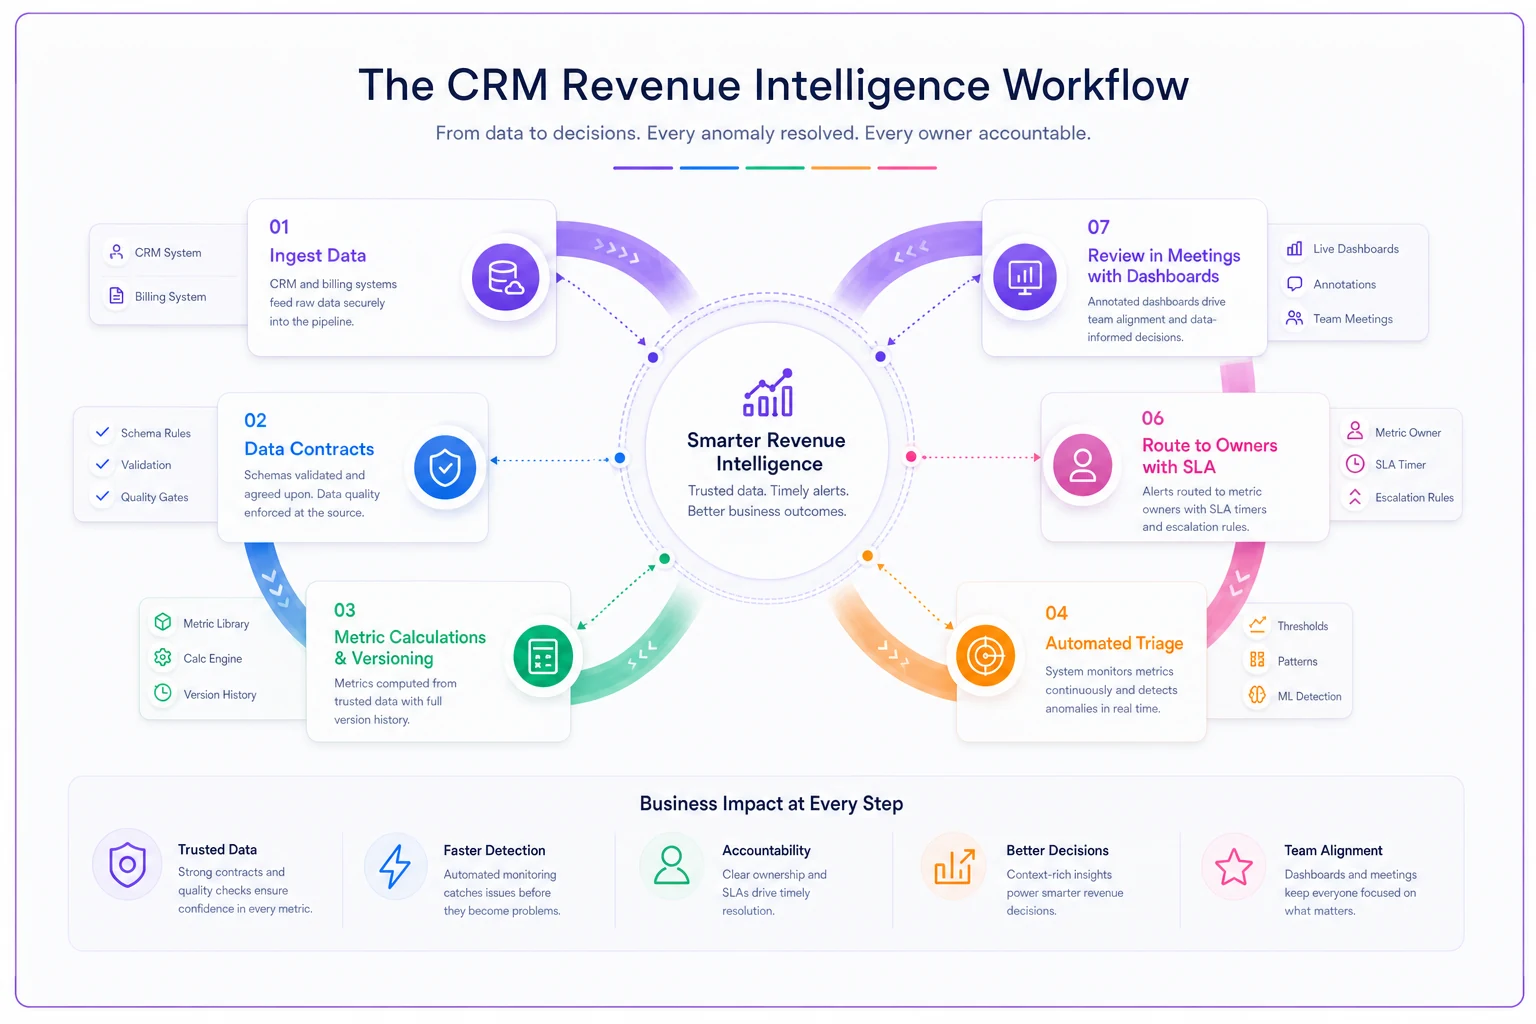
Compare that to the old way: the dip shows up live in the meeting, someone asks why, nobody knows, and the next twenty minutes go to speculation. Same data. Completely different outcome. The difference is entirely the operating model around the data, not the data itself.
Executive reconciliation template
Even with all this in place, executives will occasionally see a number in one place that doesn't match another. The finance ARR and the CRM ARR won't be identical — they never are, because they're measured differently. The goal isn't to make them match. It's to explain the gap in a way that's repeatable.
A reconciliation template does exactly that. Run it monthly, before the numbers reach leadership:
-
Source A number (e.g., CRM-reported ARR) and its definition version
-
Source B number (e.g., finance-reported ARR) and its definition version
-
The gap in absolute and percentage terms
-
Known, expected reasons for the gap (timing of revenue recognition, deals booked but not yet invoiced, currency conversion)
-
Unexplained residual — the part of the gap you can't account for
-
Owner and action for closing or explaining the residual
That unexplained residual line is the one that matters. A small residual is fine and expected. A growing one is an early warning that a definition drifted or a contract broke. Tracking it over time turns reconciliation from a fire drill into a health check.
When this level of structure makes sense — and when it doesn't
Not every team needs all four pillars fully built out. Over-engineering reporting is a real failure mode, especially early.
When it makes sense:
-
You have more than one team consuming the same metrics (sales, CS, finance, leadership)
-
Multiple people can edit upstream CRM/billing data
-
You've had at least one "the numbers don't match" incident in a leadership meeting
-
ARR is large enough that a reporting error costs real money in decisions
When it's overkill:
-
You're under ~15 people and one person owns all the data
-
Everyone already looks at the same live source and there's no reporting layer to distrust
-
Your metrics are simple enough that definitions genuinely never change
Who should NOT start here: if your underlying CRM data is a mess — inconsistent stages, missing close dates, unreliable amounts — fix that first. A reporting operating model built on bad data just makes bad numbers arrive faster and more confidently. Get the data foundation right, then build the trust layer on top.
A short real scenario
A mid-market SaaS company, around 70 people, kept having the same problem in monthly reviews: the ARR number in the CRM dashboard and the one finance presented were always a bit different, and every month the meeting stalled while people argued about which was real. The gap was usually somewhere in the low six figures — not huge, but big enough to derail the conversation.
They didn't buy a new BI tool. They did three things. They versioned the ARR definition so both teams agreed on exactly what counted and when. They assigned a single owner for the CRM ARR number with a Monday-noon accuracy SLA. And they set up automated flags for any week-over-week swing beyond a threshold, routed to that owner with context attached.
Within a couple of months, the meetings changed. The gap between the two ARR numbers didn't disappear — it never should — but it became explained. The reconciliation template showed roughly $80k–$110k of the gap was revenue-recognition timing every month, consistent and expected, with a small residual they now tracked. The arguments stopped. The time that used to go to "which number is right" went to "what do we do about the mid-market slowdown." That's the whole point.
The pattern underneath all of it
Trusted reporting isn't a tooling problem, and it isn't a data-quality problem alone. It's an ownership and response-time problem wearing a dashboard costume. The teams that trust their numbers aren't the ones with the fanciest BI stack — they're the ones where every core metric has an owner, definitions change on purpose and in writing, upstream changes can't silently break things, and anomalies get caught and explained in hours instead of weeks.
This connects to how you run experiments and health scoring too — reliable measurement is the foundation under all of it. If you're building measurement discipline elsewhere, the same principles show up in customer health-score governance and in how you structure a revenue experimentation program. Get the operating model right, and the dashboard finally becomes what it was supposed to be: the thing people look at to decide, not the thing they argue about.
This connects to how you run experiments and health scoring too — reliable measurement is the foundation under all of it. If you're building measurement discipline elsewhere, the same principles show up in customer health-score governance and in how you structure a revenue experimentation program. Get the operating model right, and the dashboard finally becomes what it was supposed to be: the thing people look at to decide, not the thing they argue about.
Ready to transform your customer relationships?
Join 2,000+ businesses using Rellyly to increase sales, improve client retention, and simplify CRM workflows.