


Most revenue teams run experiments backwards. They test pricing on 12 accounts, declare victory when three convert, then wonder why the full rollout tanks their quarterly numbers. Or they A/B test email sequences on 2,000 leads without tracking downstream revenue impact, celebrating open rates while actual deal velocity stays flat.
The problem isn't testing itself. Revenue experiments typically operate in isolation from actual revenue mechanics. Sales tests a new discovery framework. Customer Success tries quarterly business reviews. Marketing tweaks lead scoring. Nobody connects these experiments to compound revenue effects, nobody calculates proper sample sizes, and definitely nobody builds learning loops that feed successful tests back into operational playbooks.
Teams that build proper experimentation infrastructure — hypothesis pipelines, statistical guardrails, instrumentation that tracks actual revenue — consistently outperform teams running ad-hoc tests based on gut feelings and cherry-picked wins. That gap is almost always infrastructure, not talent.
Why revenue experiments fail at the infrastructure level
Revenue experimentation breaks differently than product experimentation. With product tests, you control the environment. Push code, measure behavior, roll back if needed. Revenue experiments involve humans talking to humans, deals with varying contract values, and revenue recognition that might stretch across quarters.
Take a typical scenario: your head of sales wants to test a new qualification framework. They pick their top rep, have them try it for two weeks, see three quick wins, then roll it out company-wide. Six weeks later, conversion rates crater because the framework only worked for that specific rep's style, in their specific territory, with their specific customer segment.
Statistical blindness: Teams rarely calculate minimum sample sizes. Testing a new pricing model on eight enterprise deals when you need 47 for statistical significance means you're making million-dollar decisions based on noise.
Revenue lag: A test might show immediate pipeline growth but hurt renewals nine months later. Without proper cohort tracking and revenue attribution, you're optimizing for vanity metrics while eroding lifetime value.
Learning decay: Even successful experiments rarely become operational knowledge. The SDR team figures out that mentioning ROI in the first 30 seconds improves qualification rates by 23%, but six months later new SDRs still lead with feature descriptions because nobody documented the learning or built it into training.
Rollout chaos: Teams lack clear rules for scaling experiments. They'll test something on SMB accounts, see positive results, then blindly apply it to enterprise deals where the dynamics are completely different.
These aren't edge cases. This is how most revenue organizations actually operate — running tests without test infrastructure, measuring success without success criteria, learning lessons without learning systems.
Building a hypothesis pipeline that connects to revenue drivers
Real revenue experimentation starts with hypothesis discipline. Not "let's try this and see what happens" but structured predictions about cause, effect, and revenue impact.
Never miss a customer touchpoint again.
Rellyly helps you manage contacts, tasks, and sales efficiently in one platform.
- Unified customer profiles
- Automated follow-ups
- Sales pipeline tracking
No credit card required
Observation → Hypothesis → Success Metrics → Test Design → Sample Calculation
Say you notice deals stall when technical buyers join late in the evaluation. That's an observation. The hypothesis might be: "Proactively inviting technical evaluators in discovery calls will reduce time-to-close by 15-20% for deals over $50k."
Now you need success metrics. Not just "faster deals" but specific measurements:
-
Primary
median days from first call to closed-won
-
Secondary
technical objection frequency in late-stage deals
-
Constraint
win rate must not drop below 32%
The test design determines who participates and how. You'd want to test with reps who have at least six months tenure, deals in the $50k–$150k range, and industries where technical evaluation is standard. Not outliers, not your top performer hand-picked to make the numbers look good.
Sample calculation tells you how long to actually run the test. If your average rep closes four deals per month in this range, and you need 35 deals for statistical significance, you need three reps running the test for three months minimum.
Below is a visual workflow of the hypothesis pipeline.
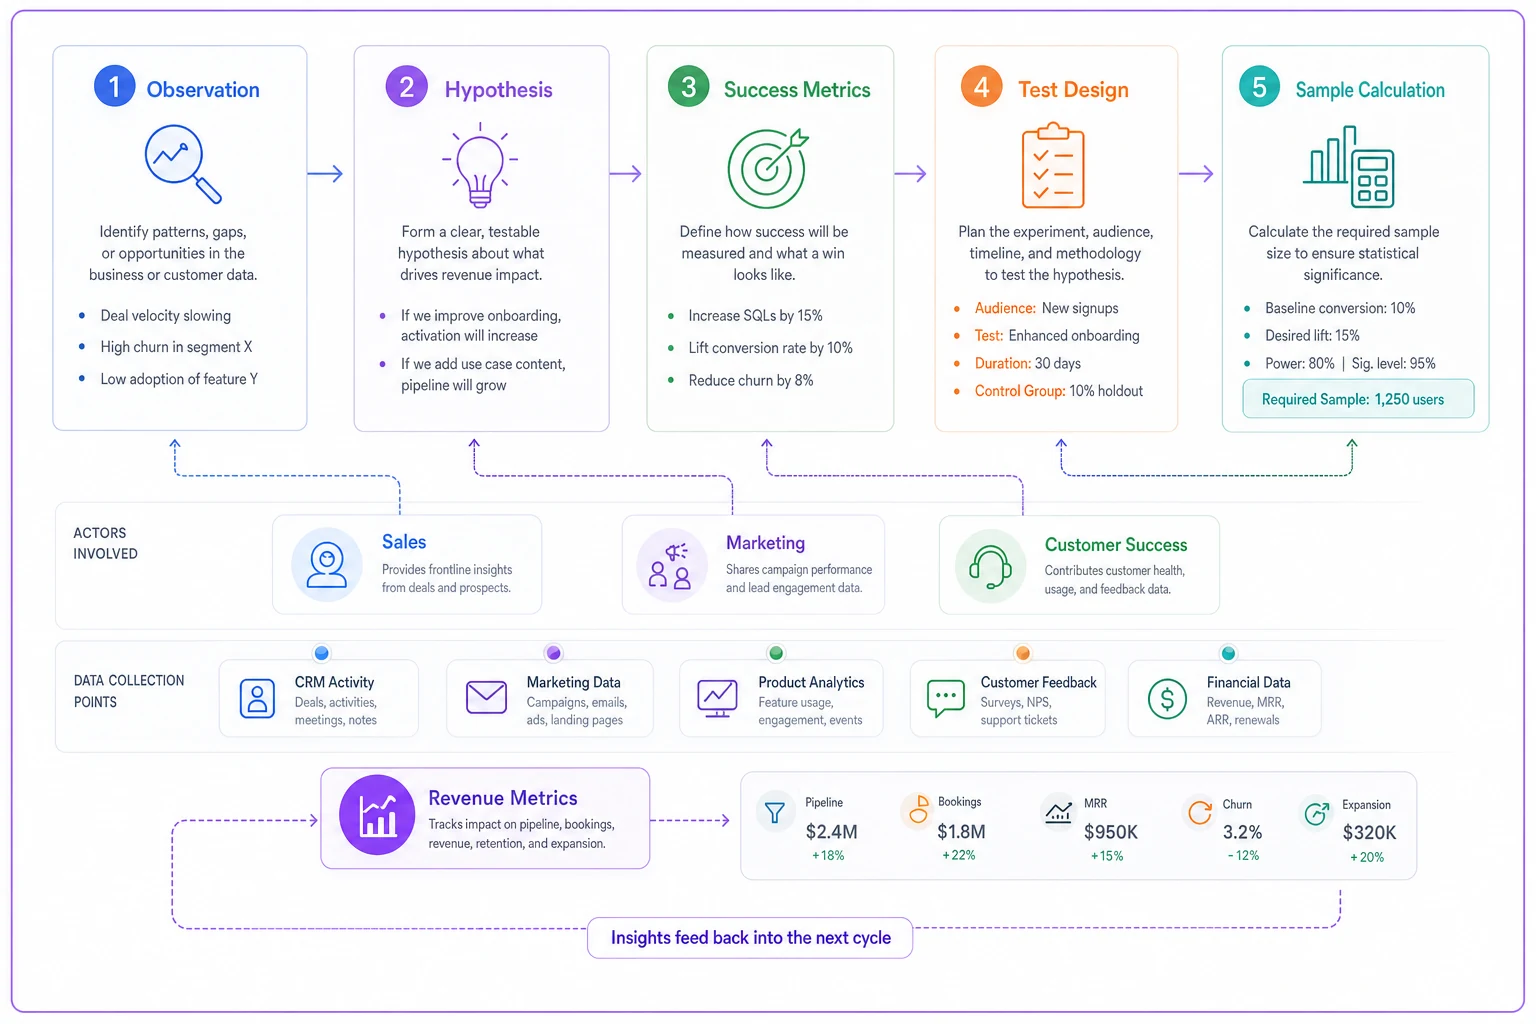
The hypothesis pipeline forces discipline. It also creates a backlog of tested ideas rather than random experiments. When Q4 planning comes around, you're not brainstorming fresh — you're selecting from pre-validated hypotheses with clear revenue connections.
Sample size rules that prevent false positives in revenue metrics
Revenue experiments need different statistical frameworks than product tests. Deal values vary wildly, sales cycles create temporal dependencies, and rep performance adds human variance that algorithms can't account for.
For binary outcomes (won/lost, churned/retained): Minimum sample = 16 × (1/baseline_rate) If your baseline win rate is 25%, you need at least 64 opportunities per variant. Not 10, not 30 — 64 minimum to detect meaningful changes.
For continuous metrics (deal size, cycle length): Minimum sample = 16 × (variance/effect_size²) If deal sizes vary by $20k standard deviation and you want to detect a $5k improvement, you need 256 deals per variant. This is why testing pricing changes on a handful of enterprise deals tells you nothing useful.
For rate changes (conversion improvements, churn reduction): Required sample = (Z-score² × baseline × (1-baseline)) / (minimumdetectablechange²) Testing whether a new discovery call framework improves qualified-to-demo conversion from 40% to 45%? You need roughly 850 calls per variant for 80% statistical power.
Most teams miss something important here: revenue experiments often need stratified sampling. Enterprise deals behave differently than SMB. New logos behave differently than expansions. Instead of pooling everything together, you stratify — run separate sample calculations per segment, test in your highest-volume segment first, and only extrapolate to genuinely similar segments.
A practical example: You want to test whether sending ROI calculators before renewal calls improves retention. Your segments break down like this:
| Segment | Monthly Renewals | Baseline Retention | Min Sample Needed | Months to Test |
|---|---|---|---|---|
| SMB (<$20k) | 45 | 78% | 120 | 3 |
| Mid-Market ($20-100k) | 18 | 85% | 95 | 5 |
| Enterprise (>$100k) | 4 | 91% | 71 | 18 |
You'd test in SMB first, then mid-market if successful, and probably skip enterprise testing altogether. Eighteen months is too long to wait for actionable results.
Instrumentation checklist for tracking compound effects
Revenue experiments create cascade effects that simple A/B testing misses. Change your qualification criteria and you might improve close rates but damage implementation success. Modify pricing and you might boost new sales while crushing expansion revenue.
Pre-conversion signals — response rates to outreach, meeting show rates, discovery-to-demo conversion, demo-to-proposal conversion, proposal-to-close conversion, and time between each stage.
Conversion mechanics — win rate by segment, competitive win/loss ratios, deal size distribution, discount depth and frequency, contract term distribution, and payment terms.
Post-conversion health — time to first value, implementation completion rates, feature adoption velocity, support ticket volume, health score progression, and expansion opportunity creation.
Revenue recognition — monthly recurring revenue by cohort, gross revenue retention, net revenue retention, lifetime value by acquisition channel, payback period distribution, and cash collection timing.
Most teams track maybe 20% of these. They'll measure win rates but not implementation success. They'll track MRR but not cohort retention. They'll celebrate initial pipeline wins while missing downstream damage.
When you test a new sales methodology, you're not just measuring close rates. You're measuring whether those deals stick, expand, and refer others. Build dashboards that show compound effects:
-
Test variant A
+15% close rate, -8% six-month retention
-
Test variant B
+8% close rate, +12% six-month retention
-
Control
baseline
Variant A looks better initially. Variant B generates more revenue over 18 months. Without proper instrumentation, you'd pick the wrong winner.
Rollout and rollback rules based on statistical confidence
The most dangerous moment in revenue experimentation is rollout. You've validated your hypothesis, hit statistical significance, and now you're ready to scale. This is where things actually go wrong.
Smart teams build rollout rules before running experiments, not after. Here are the five triggers required before moving to limited rollout:
-
Statistical significance achieved (p < 0.05)
-
Minimum sample size reached
-
No negative impact on constraint metrics
-
At least one complete sales cycle observed
-
Variance is stable and not worsening over time
Pass all five, and you can move to limited rollout — typically 25% of eligible reps or accounts.
Rollback triggers work differently. Any single trigger forces rollback:
-
Primary metric drops below 90% of baseline for 5 consecutive days
-
Constraint metrics breach predetermined thresholds
-
Operational chaos indicators (rep complaints, process breakdown)
-
Customer escalations increase by 50%
-
Revenue recognition issues emerge
Here's what this looks like in practice. You test a new contract negotiation approach that shortens cycles by 6 days, validated on 67 deals. Your rollout plan:
-
Week 1-2
Roll out to 3 additional reps (25% of team). Monitor daily win rates, track discount depths, check legal review times.
-
Week 3-4
If stable, expand to 6 reps (50% of team). Compare performance across rep tenure levels, monitor customer feedback, verify finance can handle new terms.
-
Week 5-6
If still stable, full team rollout — except the enterprise team (different dynamics) and new reps under three months tenure.
-
Week 8
Evaluate enterprise pilot feasibility.
You also set rollback triggers in advance: win rate drops below 28%, average discount exceeds 22%, legal review time exceeds 5 days, or three or more deals fail financing approval.
This isn't paranoid — it's protective. Revenue experiments can crater quarters if they scale wrong. Your rollout rules are guardrails against overconfidence.
Learning loops that feed successful tests back into operations
Most successful experiments die in implementation. The test worked, the rollout succeeded, then six months later nobody remembers what was learned or why it mattered.
Learning loops solve this by embedding experiment results into operational DNA across four areas:
Documentation loop — every completed experiment produces a one-page result summary, an updated playbook section, a training module for new hires, a FAQ for common questions, and a metric dashboard for ongoing monitoring.
Training integration — successful experiments automatically trigger onboarding curriculum updates, role-play scenario additions, certification requirement changes, manager coaching topics, and peer learning sessions.
Process codification — validated improvements become CRM workflow updates, email template modifications, call script adjustments, qualification criteria changes, and handoff process updates.
Performance management — test learnings flow into KPI definitions, quota setting models, territory planning logic, compensation plan factors, and promotion criteria.
Here's a concrete example. You test and validate that deals with three or more stakeholders engaged before the demo close 40% faster. The learning loop activates:
-
Documentation Update the sales playbook with multi-threading requirements
-
Training Add stakeholder mapping to onboarding week two
-
Process CRM now requires three contacts before moving to demo stage
-
Performance Pipeline reviews now track stakeholder count as a leading indicator
This is where AI-powered operational software makes a real difference. Instead of manually updating twelve different systems, automated workflows can propagate learnings across your entire revenue operation. The experiment ends, the system updates playbooks, adjusts workflows, and notifies teams — without someone manually chasing it down.
Without learning loops, you're running expensive experiments that evaporate. With them, every test compounds into operational intelligence that actually sticks.
Common revenue experiment mistakes and their statistical fixes
Even teams trying to run proper experiments stumble into predictable traps.
The winner's curse: You test five different email sequences simultaneously. One shows 47% improvement. You roll it out company-wide. Results revert to baseline. Why? With five tests running at once, one will randomly outperform by chance. You need Bonferroni correction — divide your significance threshold by the number of simultaneous tests.
Seasonal confounding: You test a new pricing model in Q4, see great results, roll out in Q1, and revenue tanks. Q4 buyers have budget to burn; Q1 buyers scrutinize every dollar. Always test across multiple time periods or compare against historical seasonality.
The rep effect: Your top performer volunteers to test the new methodology. Results are amazing. Rollout fails because average reps can't execute at that level. Randomly assign test participants and stratify by performance tier.
Cherry-picked metrics: The test improves meeting-to-opportunity conversion by 30% — but opportunities are lower quality, so overall revenue drops. Define success metrics holistically before starting, not after seeing results you like.
Survivorship bias: You measure only deals that closed, ignoring deals that died during the test. The new process might be killing more deals early, which could be good or bad, but you'll never know if you only analyze winners.
Here's a quick reference for fixing each of these:
| Mistake Type | Detection Method | Statistical Fix |
|---|---|---|
| Multiple testing | Track all concurrent tests | Bonferroni correction or FDR control |
| Time confounding | Compare to historical periods | Difference-in-differences analysis |
| Selection bias | Audit test participant selection | Random assignment with stratification |
| Metric gaming | Pre-register all metrics | Composite success metrics |
| Survival bias | Track entire funnel | Intent-to-treat analysis |
The fixes aren't complex, but they require discipline. Document your hypothesis before testing. Define success before seeing results. Analyze failures as thoroughly as successes.
Linking experiments to revenue forecasting models
The real goal of revenue experimentation isn't just improvement — it's predictable improvement. When you can confidently say "this change will add $2.3M in annual revenue," you move from testing to strategic revenue engineering.
This requires linking experiments directly to forecasting.
Before any test, you need stable baselines: 13-week rolling averages for key metrics, variance bands showing how much metrics naturally fluctuate, seasonal patterns documented, and cohort performance tracked over time.
Every experiment should produce a point estimate of improvement (e.g., +12% win rate), a confidence interval (e.g., 8% to 16%), a revenue translation (e.g., $340k quarterly impact), and a ramp time showing how long until full impact hits.
Successful experiments then update your forecasting model — adjusting baseline assumptions, modifying growth curves, updating confidence ranges, and flagging dependencies between metrics.
Here's what this looks like operationally. You validate that targeted executive outreach improves enterprise close rates from 22% to 29%. Your forecasting model updates:
-
Enterprise pipeline coverage requirement drops from 4.5x to 3.4x
-
Quarterly enterprise quota capacity increases from $2.8M to $3.7M
-
Sales hiring needs reduce by one enterprise rep
-
Commission expense forecast increases by roughly $67k (more deals closing)
The experiment doesn't just tell you what worked. It tells you how to adjust every connected forecast and plan downstream.
When to run experiments vs. when to standardize
Not everything should be an experiment. Teams that test everything in parallel create their own kind of chaos.
Experiment when:
-
Performance varies significantly across reps or segments
-
You're entering new markets or segments
-
Baseline metrics are below industry standards
-
Major market shifts occur
-
New tools or capabilities become available
Standardize when:
-
Something works consistently across contexts
-
Variance is harming customer experience
-
Regulatory or compliance requirements exist
-
Coordination between teams is critical
-
Training new hires is a bottleneck
When you're unsure which path to take, work through this decision sequence:
-
Is current performance acceptable? If yes, standardize. If no, continue.
-
Is variance harmful? If yes, standardize. If no, continue.
-
Do we understand why performance varies? If no, experiment. If yes, continue.
-
Can we segment effectively? If yes, standardize per segment. If no, experiment.
A real example: a SaaS company noticed demo-to-close rates varied from 18% to 45% across their eight reps. Instead of forcing standardization or letting chaos reign, they identified that variance correlated with customer segment (SMB vs. mid-market), ran experiments to find optimal approaches for each, and standardized two distinct playbooks. Variance dropped to 35–42% for SMB and 22–28% for mid-market. Higher overall performance than either pure standardization or pure experimentation would have achieved.
Building experimentation rhythm into revenue operations
Revenue experimentation can't be a special project. It needs to be woven into operational rhythm — the calendar, the meetings, the metrics.
Quarterly experiment planning:
-
Week 1
Harvest observations from the previous quarter
-
Week 2
Generate hypothesis backlog
-
Week 3
Prioritize based on potential impact
-
Week 4
Design tests and calculate samples
Monthly experiment reviews:
-
Active test status and early signals
-
Sample size progress
-
Rollout and rollback decisions
-
Learning documentation
Weekly operational check-ins:
-
Flag new observations
-
Monitor test metrics
-
Catch early problems
-
Share tactical learnings
This rhythm prevents two failure modes: random experimentation that lacks strategy, and analysis paralysis that prevents testing altogether.
Your revenue experimentation playbook becomes a living system — hypothesis pipeline feeding quarterly planning, statistical rigor preventing false positives, instrumentation catching compound effects, rollout rules preventing operational chaos, and learning loops cementing improvements into how the team actually operates.
Some teams try to maintain all of this manually with spreadsheets and weekly meetings. It works for about six weeks before decay sets in. The teams that sustain experimentation culture build it into their operational software — automated experiment tracking, statistical significance calculations, and learning propagation that doesn't depend on someone remembering to update a Google Doc.
Moving from ad-hoc tests to revenue experimentation infrastructure
The gap between teams that randomly test things and teams that systematically improve isn't talent or creativity — it's infrastructure. Proper hypothesis pipelines, statistical frameworks, instrumentation, and learning loops turn experimentation from a distraction into a compounding advantage.
Most revenue teams are still throwing things at the wall, celebrating random wins, and wondering why improvements don't stick. They run a pricing test here, a sales methodology experiment there, but never build the infrastructure to turn experiments into systematic revenue growth.
Start with one well-designed experiment. Calculate proper sample sizes. Instrument the full revenue chain. Document rollout rules before you start. Build learning loops that cement improvements into operations.
Your revenue experimentation playbook isn't just about running better tests — it's about building an organization that systematically identifies, validates, and scales revenue improvements. In a world where competitors copy features in weeks and marketing channels saturate in months, the ability to continuously experiment and improve revenue operations is about the only sustainable edge left.
The question isn't whether to experiment. It's whether you'll build the infrastructure to do it right, or keep running ad-hoc tests that occasionally work but never systematically compound into revenue growth.
Start with one well-designed experiment. Calculate proper sample sizes. Instrument the full revenue chain. Document rollout rules before you start. Build learning loops that cement improvements into operations.
The question isn't whether to experiment. It's whether you'll build the infrastructure to do it right, or keep running ad-hoc tests that occasionally work but never systematically compound into revenue growth.
Ready to transform your customer relationships?
Join 2,000+ businesses using Rellyly to increase sales, improve client retention, and simplify CRM workflows.