
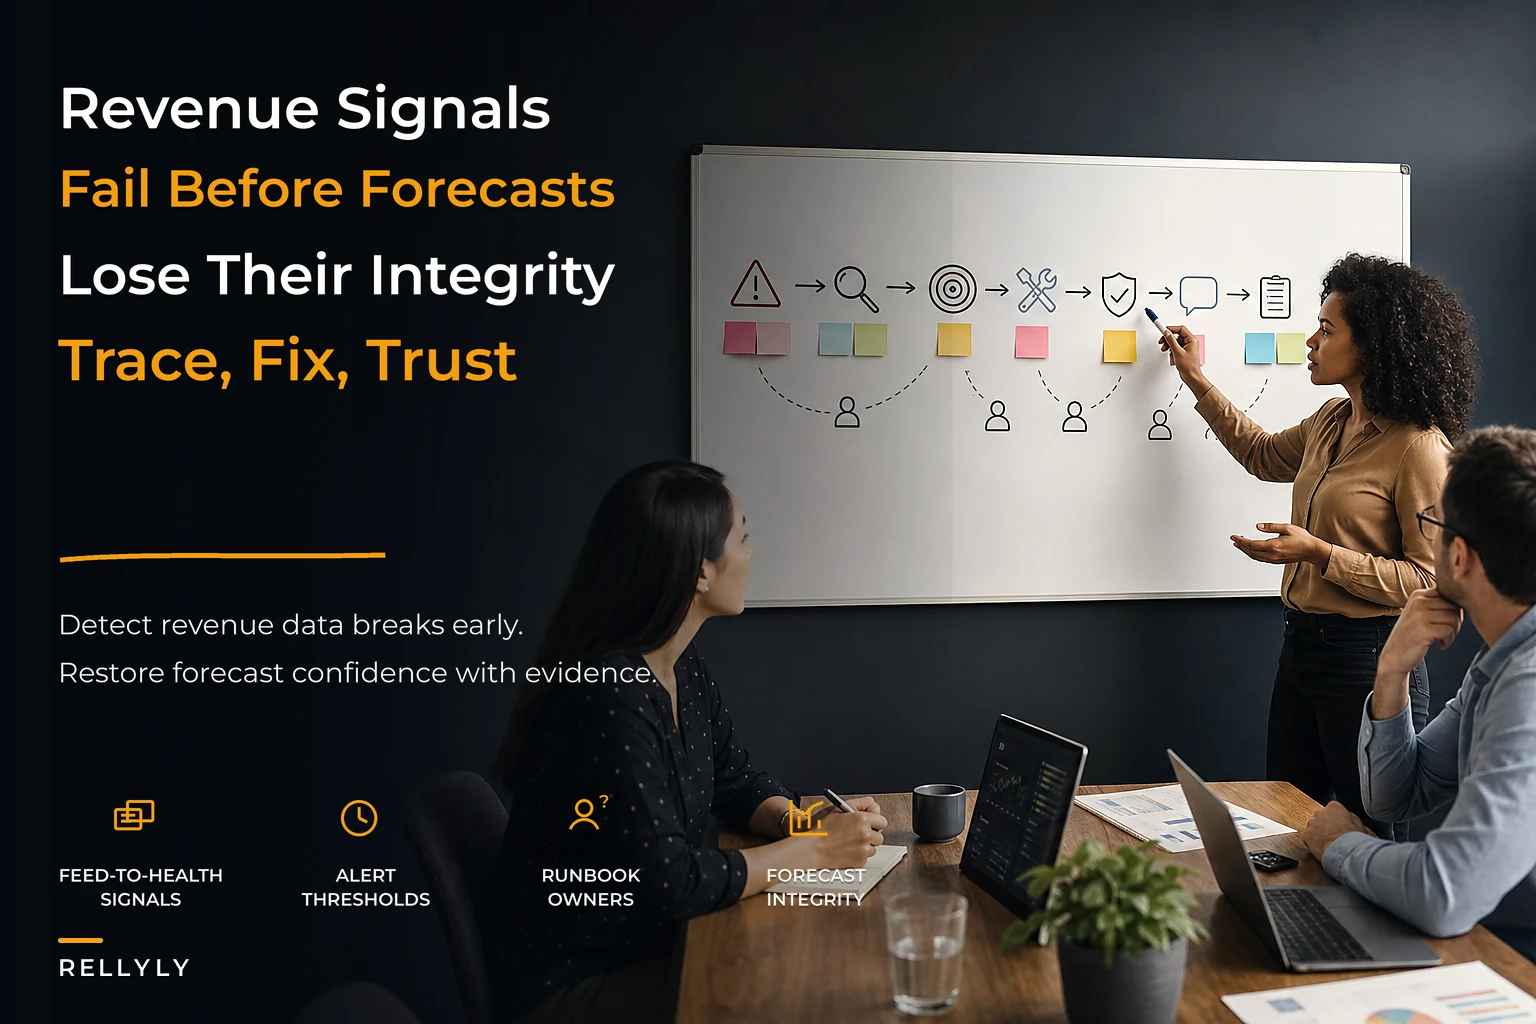

Most revenue teams find out their forecast was wrong at the worst possible moment: mid-quarter, on a board call, when someone finally asks why committed pipeline shrank $400k overnight. By then the damage is done. The number was broken for weeks — a sync job silently failed, a stage definition drifted, a health score stopped updating — and nobody noticed because nobody was watching the data the way they watch the deals.
That's the gap revenue data observability fills. Not another dashboard. A monitoring layer that treats your revenue data like the production system it actually is, so distortions get caught in hours instead of surfacing as a nasty surprise at close.
This isn't about buying more BI tooling. It's about instrumenting the pipeline from raw signal to reported number, knowing where data comes from, and having alerts that fire before the forecast is already wrong.
Why forecasts break quietly instead of loudly
Revenue data degrades gradually, not all at once. A broken forecast almost never comes from one dramatic failure. It's usually an accumulation of small distortions that each look fine in isolation.
A typical example: your enrichment provider changes an API field name. The mapping into your CRM breaks, so firmographic data stops flowing. Nothing errors out — records just quietly come in with blank fields. Three weeks later, your lead scoring model (which weights company size heavily) starts scoring everything lower. MQL volume drops 20%. Sales complains lead quality is down. Marketing swears volume is up. Everyone's arguing about a symptom, and the actual cause is a field name that changed on a Tuesday.
This is the core problem. In most revenue orgs, data flows through six or seven systems — website forms, enrichment, CRM, marketing automation, product telemetry, billing, the data warehouse — and each handoff is a place where things can silently drift. There's no single throat to choke because the failure isn't in any one system. It's in the seams between them.
What you see repeatedly with small and mid-sized revenue teams is that they instrument their outcomes obsessively (win rate, ARR, pipeline coverage) but instrument the inputs to those outcomes not at all. Twelve dashboards on pipeline, zero alerts on whether the data feeding those dashboards is fresh, complete, or internally consistent.
The four signal layers worth monitoring
Observability only works if you're watching the right things. Watching everything is basically the same as watching nothing — you drown in noise and mute the alerts within a week. Forecast integrity comes down to four layers of signal.
Never miss a customer touchpoint again.
Rellyly helps you manage contacts, tasks, and sales efficiently in one platform.
- Unified customer profiles
- Automated follow-ups
- Sales pipeline tracking
No credit card required
Freshness signals. Is the data arriving on time? A CRM sync that normally runs every 15 minutes but hasn't updated in six hours is a five-alarm problem even if every existing record looks correct. Stale data is invisible because the numbers don't look wrong — they just stopped moving. The classic tell: a rep swears they logged three deals this morning and the pipeline report shows none.
Volume signals. Is the amount of data in a normal range? If you typically create 40–60 new opportunities a day and suddenly see 4, or 400, something upstream changed. Volume anomalies catch broken forms, duplicate-creating integrations, and failed imports faster than almost anything else.
Distribution signals. This is the one most teams skip, and it tends to be the most valuable. It's not about how much data — it's about whether the shape of the data shifted. If 70% of your pipeline normally sits in stages 2–3 and suddenly 40% is sitting in stage 5, either your business had an incredible week or someone's mass-updating stages incorrectly. Distribution drift is how you catch the subtle stuff.
Lineage signals. Can you trace a reported number back to its source? When the forecast says $2.1M committed, can you follow that number back through the transformation logic, back to the CRM records, back to the raw activity that created them? Without lineage, every investigation starts from zero.
| Signal layer | What it catches | Example threshold |
|---|---|---|
| Freshness | Broken syncs, stalled jobs | No CRM update in >2x normal sync interval |
| Volume | Failed imports, duplicate floods | Daily opp creation outside ±40% of trailing 14-day avg |
| Distribution | Stage drift, mass edits, scoring breaks | Stage mix shift >15 points week-over-week |
| Lineage | Untraceable numbers, silent transform errors | Any KPI with a broken source-to-report path |
Freshness and volume alerts are relatively easy to set up but shallow. Distribution and lineage are harder to instrument but tend to catch the failures that actually cost you the quarter.
Feed-to-healthscore: watching the chain, not the endpoints
Two of the most forecast-critical numbers in any revenue org are health scores and pipeline deltas. Both are derived — calculated from underlying feeds — which means they can be confidently wrong. A health score that reads 82 looks trustworthy right up until you realize the product usage feed it depends on stopped updating a week ago.
Consider the full chain behind a single account health score:
-
Product telemetry fires usage events
-
Events land in the warehouse
-
A transformation aggregates them into feature-adoption metrics
-
Support ticket volume gets joined in
-
The health model combines everything into a score
-
That score drives CS prioritization and renewal risk in the forecast
Every one of those six steps can break independently, and the score will still render a confident number. Watching the endpoint — the health score itself — isn't enough. You have to watch the chain. If step 2 stalls, the score should throw a data-quality flag, not silently coast on last week's inputs.
The practical fix is attaching a confidence flag to every derived metric based on the freshness and completeness of its feeds. A health score built on complete, current data is trustworthy. One built on a feed that's 40% null or 8 hours stale should be visibly marked as unreliable — not quietly reported as fact. If you're already investing in scoring, the customer health-score governance approach with calibration gates and rollback plans pairs naturally with feed-level monitoring: governance handles whether the model is right, observability handles whether the inputs are.
The same logic applies to pipeline deltas. A "pipeline grew $300k this week" number is only as trustworthy as the stage-change events behind it. Monitor the deltas and the events driving them. When a delta looks unusual, you want to immediately see whether it came from real deal progression or from a bulk edit someone ran before a pipeline review.
Setting alert thresholds that people don't mute
The fastest way to kill an observability program is bad thresholds. Alert too aggressively and everyone mutes the channel within two weeks. Alert too loosely and you catch nothing.
Use relative thresholds, not absolute ones. "Alert if daily opp creation drops below 10" breaks the moment your business grows or hits a slow week. "Alert if daily opp creation falls outside ±40% of the trailing two-week average" adapts to your actual baseline. Absolute thresholds age badly.
Tier your alerts by blast radius. Not everything deserves a 2am page. A useful split:
-
Critical — feeds forecast or board numbers directly. CRM sync down, ARR pipeline broken, revenue KPIs untraceable. Page someone.
-
Warning — degrades quality but doesn't break reporting yet. Enrichment feed 30% null, one region's data delayed. Slack channel, business hours.
-
Info — worth logging, not worth interrupting anyone. Minor distribution shift, small volume wobble. Digest email.
Build a warm-up period. New metrics have no baseline. Alert immediately and you get noise for two weeks while the system learns what normal looks like. Give anomaly detection at least 10–14 days of history before it starts firing.
Start with the five alerts that map directly to forecast integrity and prove they're reliable before expanding.
The mistake that kills most rollouts: launching with 50 alerts on day one. Start with the five that map directly to forecast integrity. Prove they're reliable. Then expand. An observability system nobody trusts is worse than none — it creates false confidence instead of removing it.
Ownership runbooks: the part everyone skips
What separates observability that works from observability that just generates anxiety is simple: every alert needs an owner and a runbook before it's turned on. An alert with no owner is just a notification everyone assumes someone else is handling.
A runbook doesn't need to be elaborate. It needs to answer four questions fast:
-
Who owns this alert? A named person or role, not "the ops team."
-
What does it mean? Plain language. "The enrichment feed hasn't updated in 4 hours" — not a raw error code.
-
How do you diagnose it? First three things to check, in order.
-
What's the escalation path? If the owner can't resolve it in X minutes, who's next.
In practice: RevOps owns pipeline and forecast data alerts. CS ops owns health score and product-feed alerts. Whoever owns the integration owns freshness alerts for that specific system. The exact split matters less than the fact that every alert has a name attached before it ever fires.
This is also where data hygiene and observability reinforce each other. Observability tells you when something broke; hygiene practices keep the underlying records clean enough that alerts stay meaningful. If your CRM is full of duplicates and half-filled records, your anomaly detection will flag noise constantly. The CRM data-hygiene playbook for stopping bad forecasts covers the input-quality side — think of observability as the monitoring layer that sits on top of clean data and catches when it starts to degrade again.
Recovery playbooks: from alert to trustworthy number
Detecting a problem is half the job. The other half is a repeatable path back to a trustworthy forecast. Recovery playbooks turn "the health scores are broken" panic into a sequence anyone can follow.
-
Contain. Flag every downstream metric as unreliable immediately. Better to show "data quality issue" than a confident wrong number someone makes a decision on.
-
Diagnose. Use lineage to trace back to the break point. Was it the source, a transformation, or the sync? Lineage turns a two-hour hunt into a ten-minute trace.
-
Assess blast radius. Which reports, scores, and forecast lines depend on this feed? You can't communicate impact without knowing scope.
-
Fix and backfill. Repair the break, then reprocess the affected window so historicals are corrected — not just data going forward.
-
Validate. Confirm the numbers now reconcile against a known-good source before you un-flag anything.
-
Communicate. Tell the people who consumed the bad data during the outage. If the forecast was overstated for a week, the people who acted on it need to know.
-
Post-mortem. What was the root cause, and what monitor would have caught it sooner? Every incident should produce a new or tightened alert.
That last step is what compounds over time. A revenue observability practice gets stronger with every incident, because each failure reveals a monitor you were missing. Teams that skip the post-mortem keep getting surprised by the same class of failure.
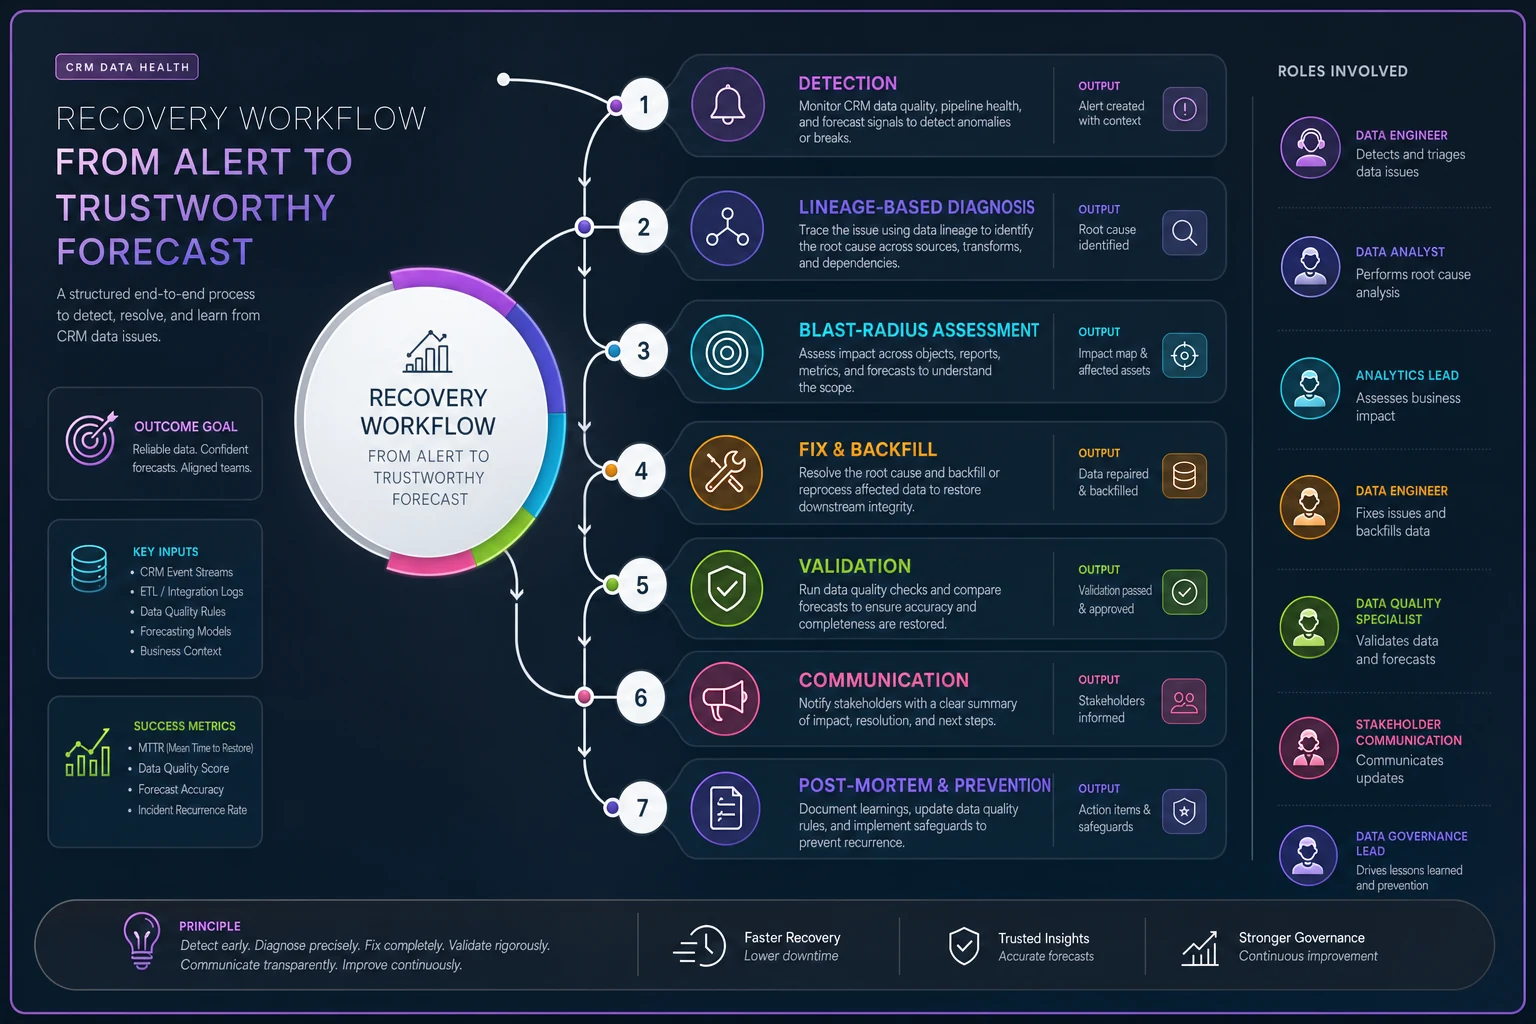
This diagram maps the recovery sequence and responsibilities so teams can move from alert to a trusted number quickly.
A real scenario: the frozen health scores
A B2B SaaS company with roughly 900 active accounts ran a CS motion where renewal risk flowed straight into the forecast from account health scores. Standard setup. The scores depended on a nightly job aggregating product usage.
That job started failing silently on a Thursday. No error surfaced to anyone who'd notice — it just stopped running. Health scores froze on Wednesday's values and kept rendering with total confidence. For about 11 days, CS prioritized based on stale data while several accounts quietly slid toward churn. Two of them — worth somewhere around $60k combined ARR — hit their renewal window still showing "healthy" and churned essentially without warning.
The fix wasn't a better health model. It was a freshness monitor on the feed. After instrumentation, a stalled aggregation job triggered a warning inside roughly an hour, and any score built on stale data got automatically flagged as low-confidence instead of displaying as fact.
Mean time to detect a feed problem dropped from over a week to under two hours. In the two quarters after, they didn't have another surprise churn tied to stale scoring data. Not a dramatic revenue swing — but a meaningful reduction in the kind of blind spots that quietly erode a forecast.
When this actually makes sense — and when it doesn't
Revenue data observability is genuinely valuable, but it's not free, and it's not right for everyone at every stage.
When it makes sense:
-
Your forecast drives real decisions — hiring, board commitments, resource allocation — and being wrong is expensive.
-
Data flows through three or more systems before it reaches a report.
-
You have derived metrics (health scores, lead scores, pipeline deltas) that people trust and act on without checking the inputs.
-
You've been burned at least once by a number that turned out to be quietly wrong.
When it's premature:
-
You're a small team with one source of truth and simple, manually-maintained data. A spot check beats a monitoring system at that stage.
-
Your data quality is so poor that everything would alert constantly. Fix the hygiene first, then layer observability on top — monitoring chaos just produces alert fatigue.
-
Nobody owns the alerts. Without ownership, observability generates anxiety, not resolution. Don't turn on a single alert until you know who answers it.
Teams that treat this as a tooling purchase rather than an operating practice tend to end up with expensive dashboards nobody trusts within a month. The platform is the easy part. The runbooks, ownership, and threshold discipline are what actually make it work.
Building it into how the team operates
The teams that get real value from this don't treat observability as a project with an end date. They fold it into the operating rhythm — a weekly review of what alerted and how it was handled, a standing owner for each data domain, and a rule that every incident produces a new or tightened monitor. It stops being a bolt-on and becomes part of how the revenue org runs.
Modern revenue platforms make the mechanics easier — automated freshness checks, anomaly detection on volume and distribution, lineage tracking that traces a number back to its source without manual archaeology. That automation handles the tedious, always-on watching that no human can reliably do at 2am. But the automation is only as good as the thresholds you set and the runbooks behind the alerts.
Forecast integrity isn't something you achieve once and keep. It's something you defend continuously, because the data feeding it is always shifting. Get the four signal layers instrumented, tier your alerts so people actually trust them, and attach an owner and a runbook to every one before it fires. That's the whole system — and it's the difference between catching a broken forecast in an hour versus finding out in front of your board.
Ready to transform your customer relationships?
Join 2,000+ businesses using Rellyly to increase sales, improve client retention, and simplify CRM workflows.